TwinCity is the result of a co-design effort between Mines PARIS - PSL and the City of Marseille, as part of the Destination Earth project funded by ESA. The goal of this application is to provide city officials with high-resolution Earth observation data useful for their work : - Urban nature management - Urban planning - Energy - ...
TwinCity adheres to the FAIR principles and relies on open-source tools and recognized standards to enable users to access data as easily as possible and derive maximum added value from it. Two interfaces are offered: - A simplified web interface for users without specific skills in Geographic Information Systems (GIS). This application allows data visualization and extraction of useful statistics. - A QGIS project allows direct access to raw data via a GeoServer implementing OGC standards. This interface is intended for mapping experts wishing to directly exploit the data with the powerful tools offered by QGIS.
The data provided are derived from satellite data (Sentinel 2 and Landsat 8) and LIDAR (IGN). Satellite data provide temporal changes over a long period (10 years) at a medium resolution (8 to 40 meters). Data cubes have been pre-extracted over the Marseille area and optimized for fast display. LIDAR data provide static high-resolution information captured in 2022.
| Name with Icon | Source | Type | Spatial Resolution | Temporal Resolution and Extent |
|---|---|---|---|---|
| 🌿 Vegetation Index (NDVI) | Sentinel 2 | temporal | 8 meters | 2014-2017 (1/month) |
| 💧 Moisture Index (NDMI) | Sentinel 2 | temporal | 15 meters | 2017-2024 (1/month) |
| 🌡 Surface Temperature | Landsat 8 | temporal | 46 meters | 2014-2024 (17/year) |
| ⛰️ Surface Model | IGN LIDAR | raster | 20 cm | 2022 |
| ☀️ Horizontal Irradiation | IGN LIDAR | raster | 1 meter | 2022 |
| ☀️ Tilted Irradiation | IGN LIDAR | raster | 1 meter | 2022 |
| 📊 Land Cover | IGN LIDAR | categorical | 20 cm | 2022 |
| 🌲 Tree Detection | IGN LIDAR | vector | - | 2022 |
The Vegetation Index (NDVI) is a dimensionless index between -1 and 1. It distinguishes vegetated areas (>0.2) from urban areas (<0.2) and monitors the health of vegetation. It is derived from Sentinel 2 data.
The Normalized Difference Moisture Index (NDMI) detects moisture levels in vegetation. It is a dimensionless index between -1 and 1. It is derived from Sentinel 2 data.
Surface temperature, in degrees Celsius, is derived from the infrared bands of Landsat 8 data. It is a value different from air temperature but provides interesting information on the heat difference between various locations.
The surface model provides the elevation at any point, in meters, with a resolution of 20 cm. It is derived from IGN LIDAR data.
The total annual solar irradiation (in kWh per meter) is calculated for all roofs in the city at a resolution of 1 meter, using CAMS Radiation data (Heliosat-4 model), taking into account shading calculated based on the high-resolution surface model above. Irradiation is calculated for both horizontal surfaces and tilted surfaces (following the roof slope).
Land classification is derived from IGN LIDAR data. It is provided at a resolution of 20 cm.
Individual trees are detected from IGN LIDAR data by searching for local maxima in the surface model in areas classified as "high vegetation" in the land cover. This layer is available only through the QGIS project.
This section describes the features of the Web Interface.
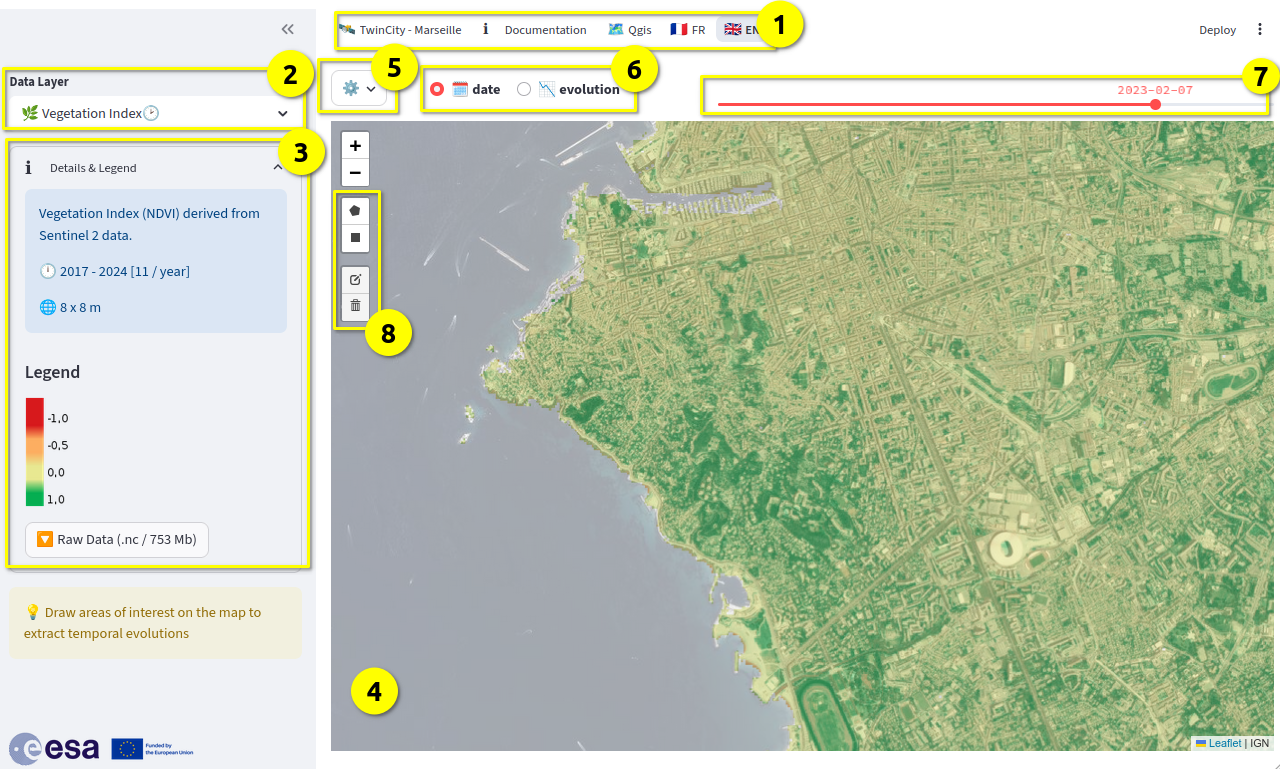
Statistical calculation is done by drawing one or more areas of interest on the map using the tools located to the left of it (rectangle and polygon [8]). As soon as at least one area is selected, statistical data appears below the map.
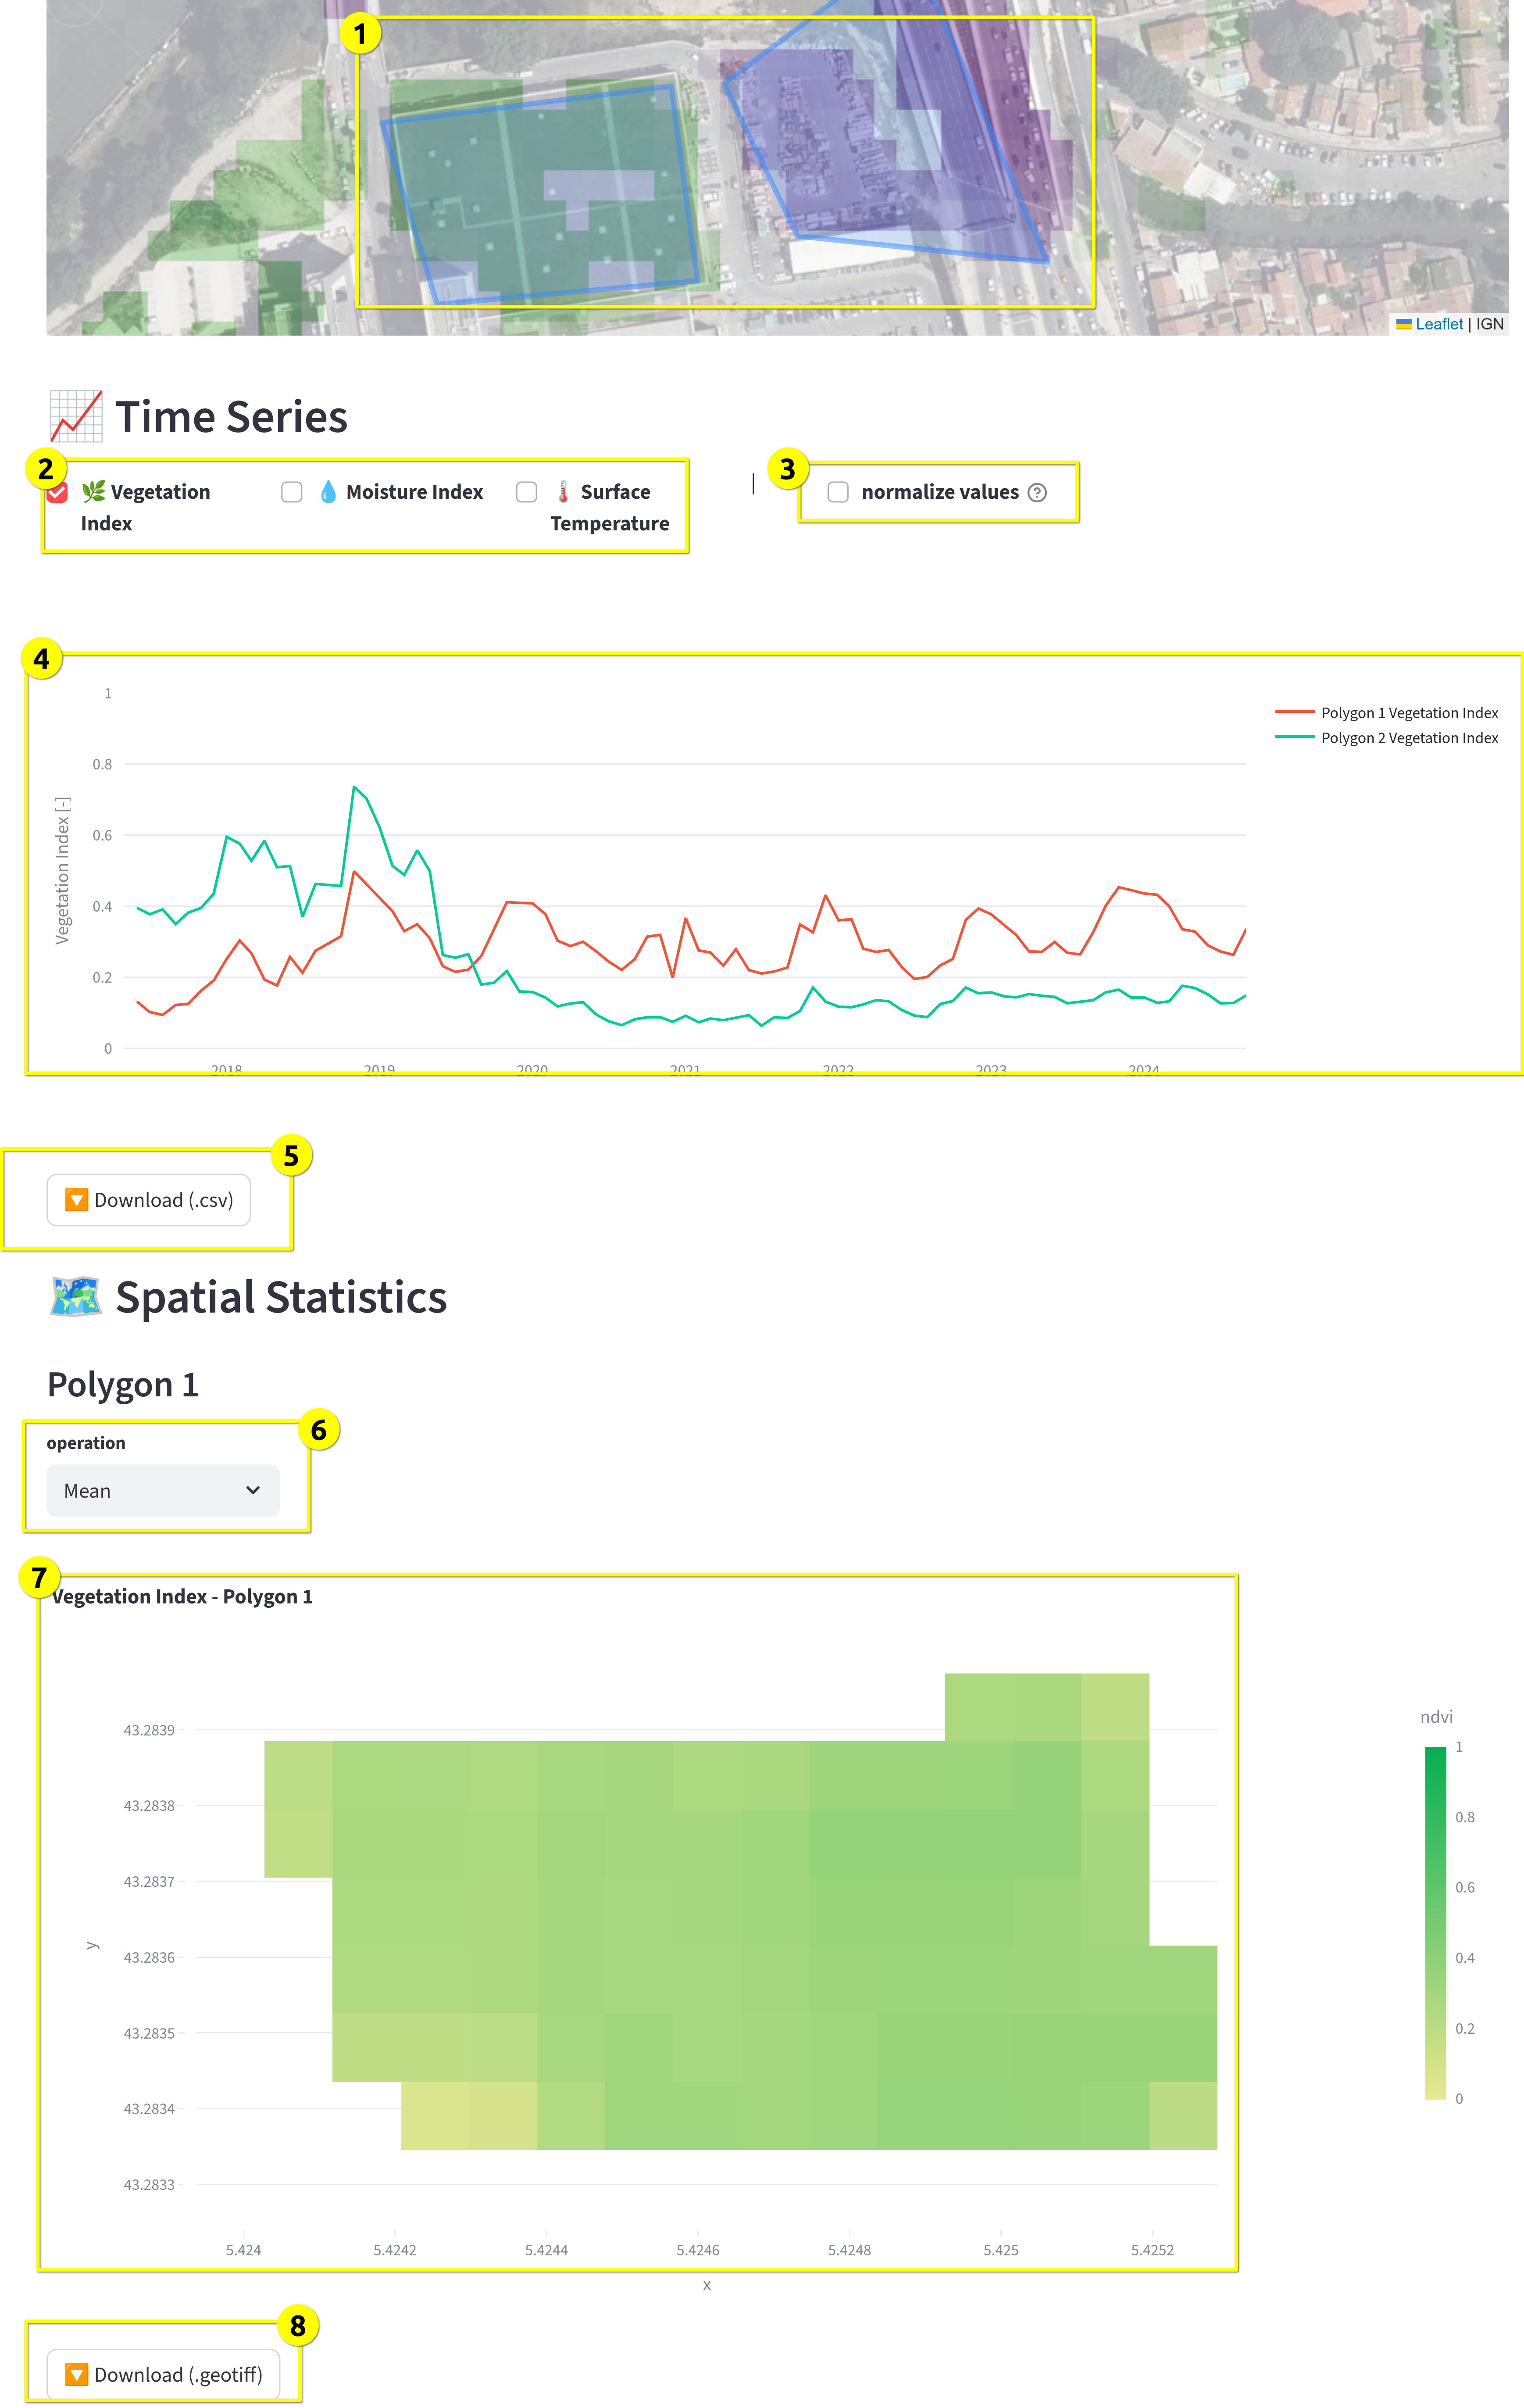
Here is an example of a result for a temporal layer (NDVI):
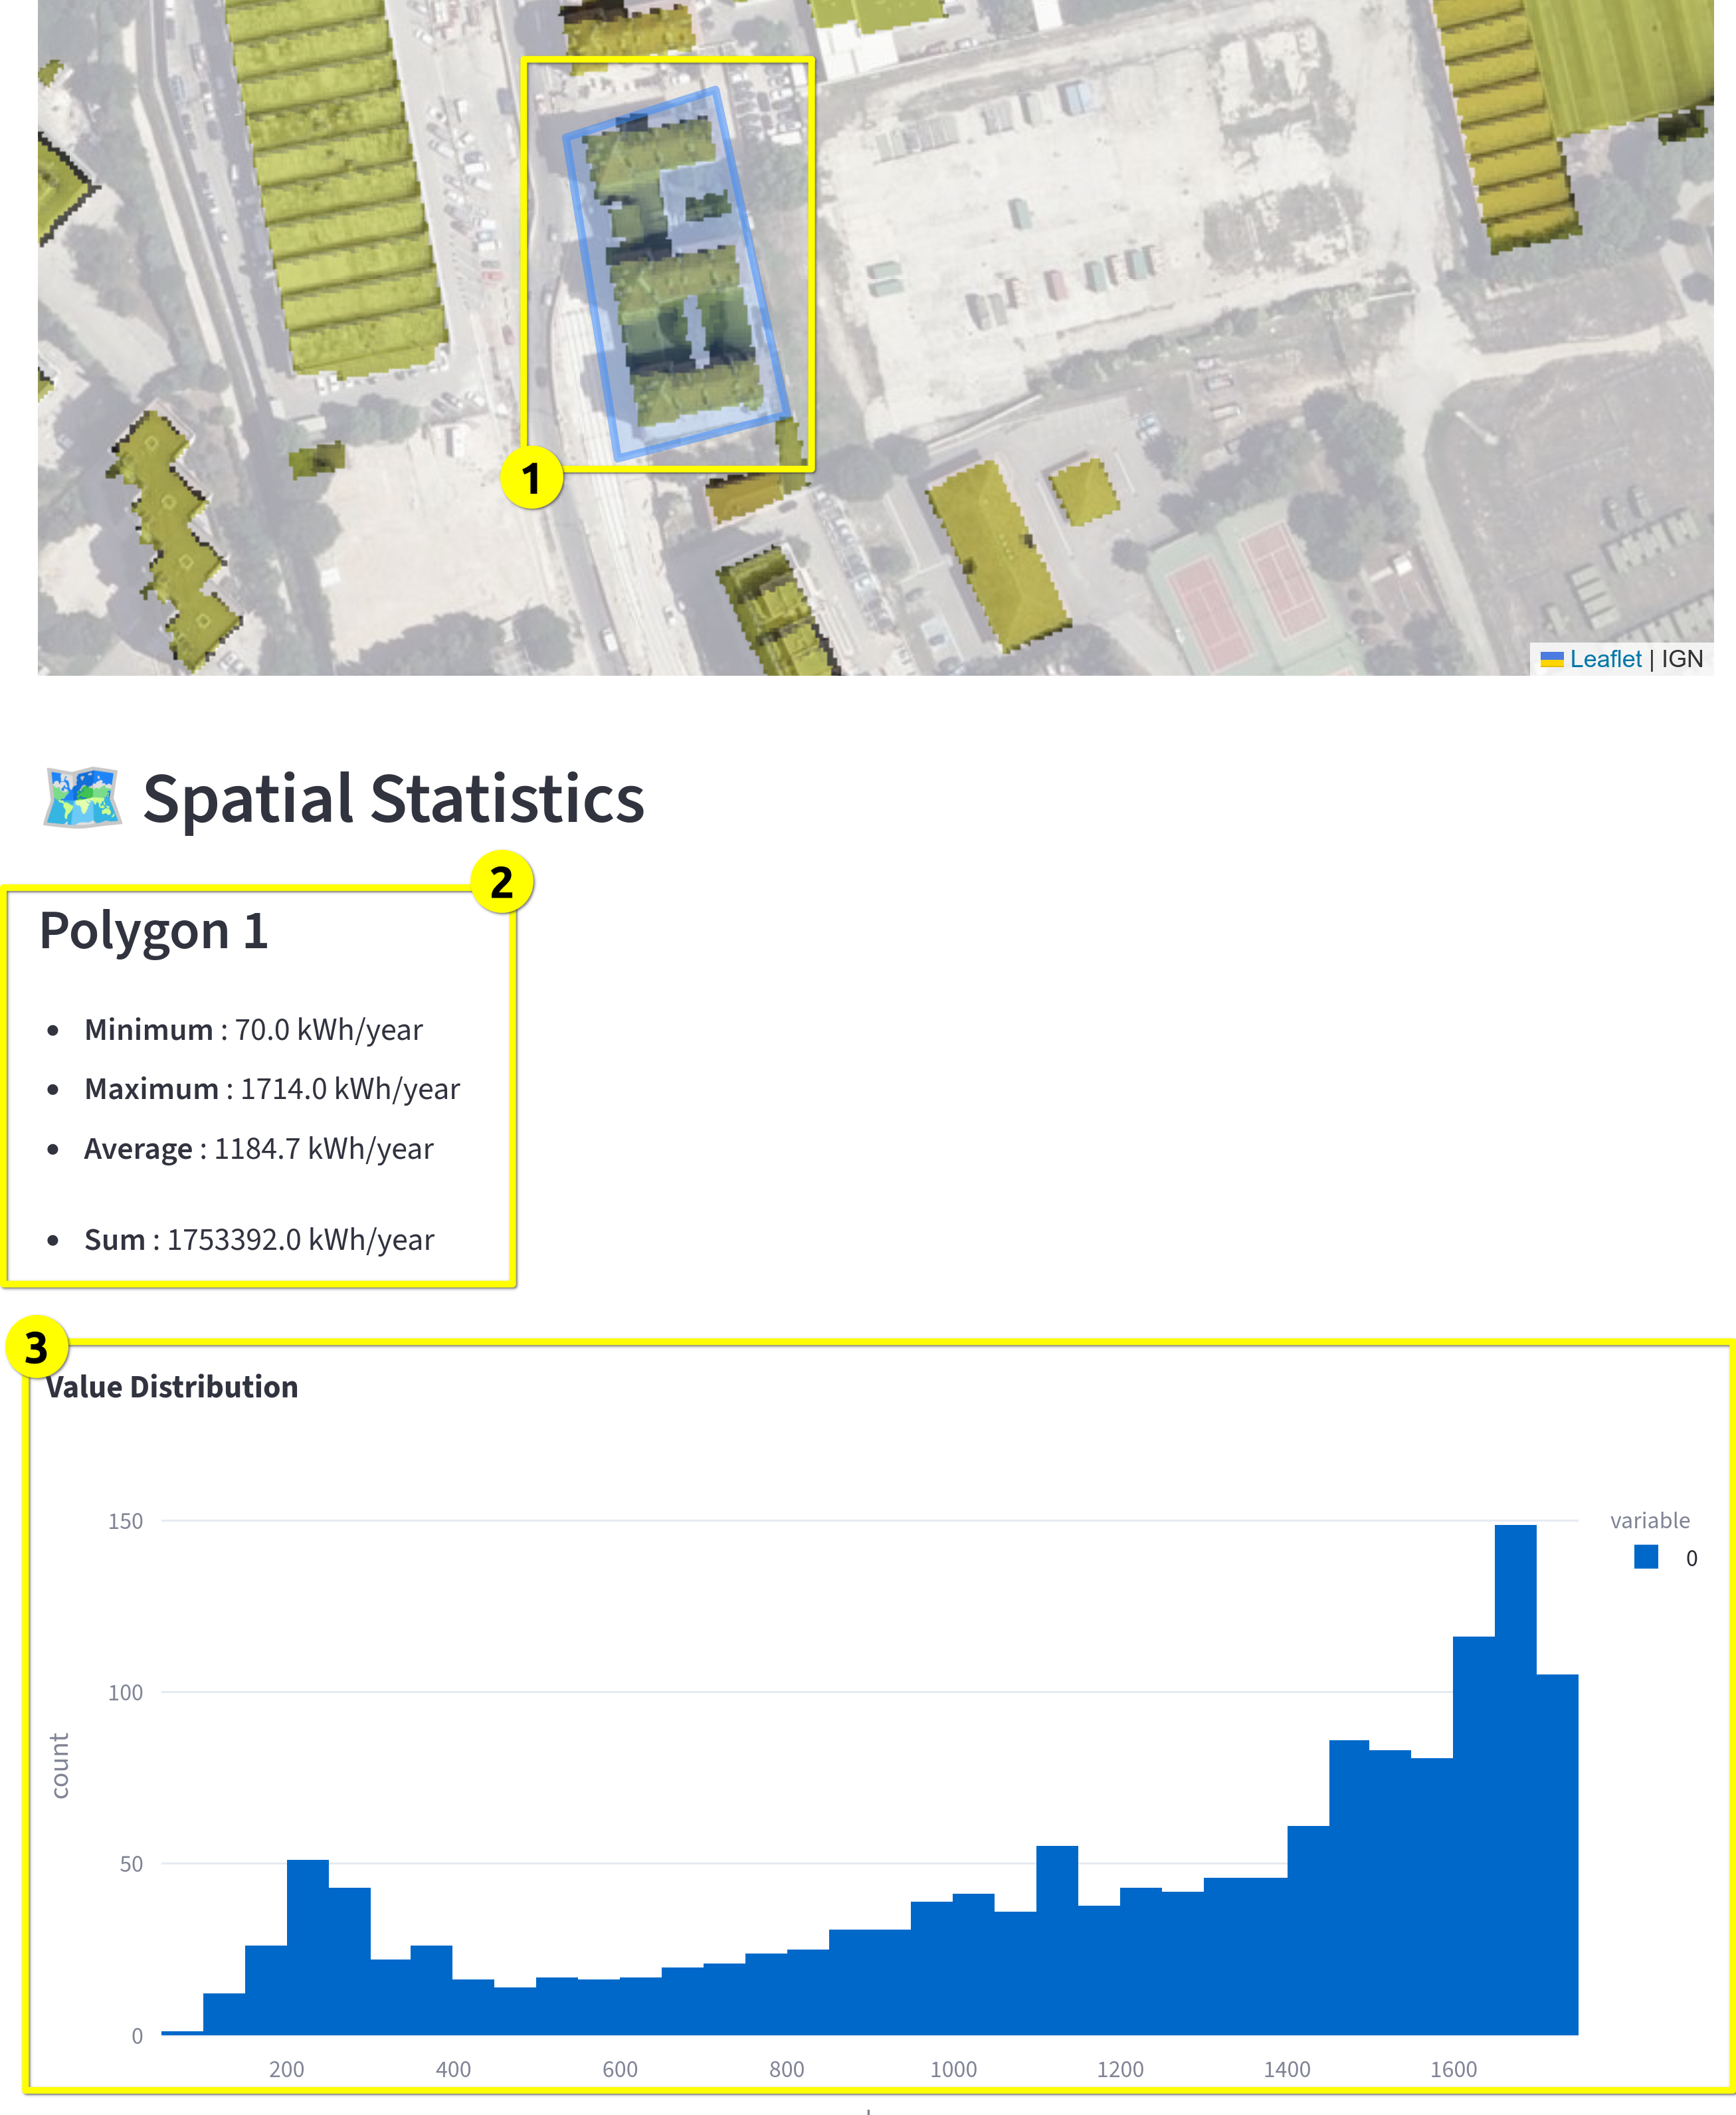
For non-temporal (raster) data, spatial statistics are presented as follows:
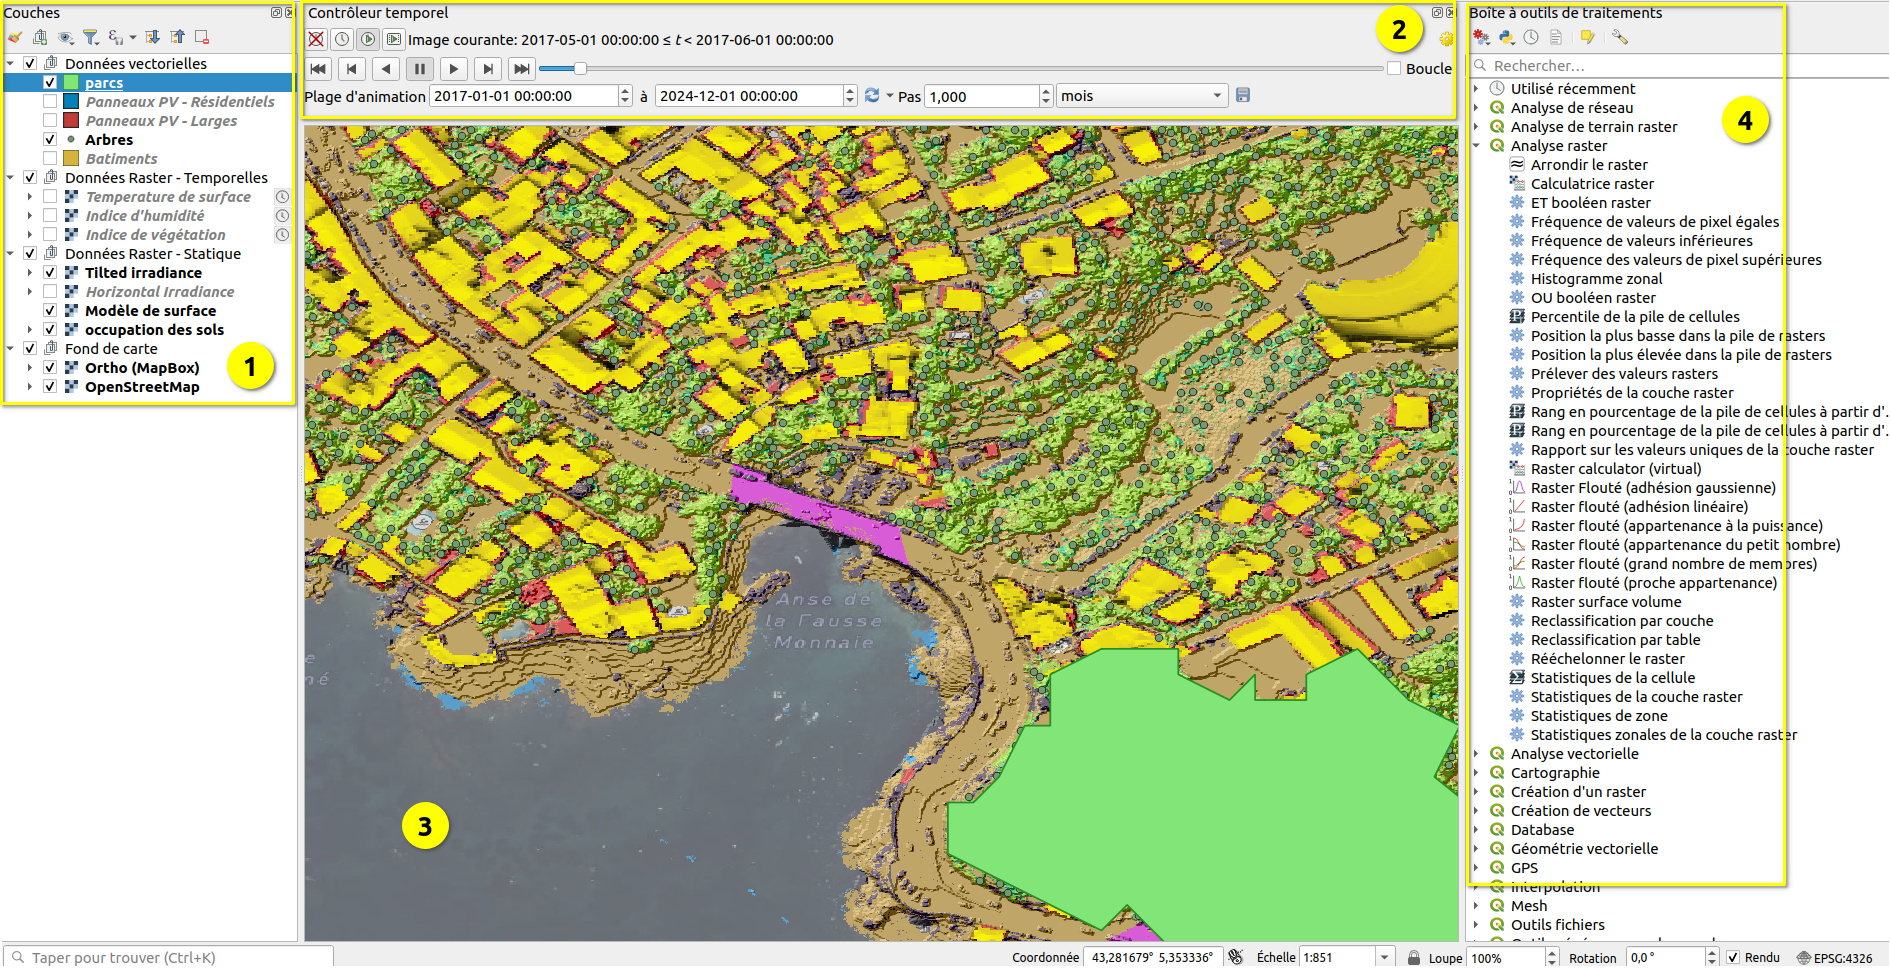
The QGIS project is available at this address. It should be opened with a recent version of the open-source software QGIS.
The provided QGIS project is already configured to automatically connect to the GeoServer. QGIS retrieves data at runtime as needed.
Here is the interface of the opened project: